Identifiers
- tylerjohnson7852
- Aug 26, 2022
- 3 min read

Updated: Aug 29, 2022
Subtleties to look for when preparing your outlook analysis.

Now that we have a slight grasp on macro trend and analysis lets dig a little deeper and think about key characteristics that stand out when performing your analysis. What are some identifiers we can observe and use to plan our outlook analysis? We all want to get the most bang for our buck in regards of risk reward. Small risk and high reward is the key factor in being profitable, but how can we identify areas that give us this opportunity? We must be able to identify highly probable turning points within our charts that will give us a multi day/week/month trade. So what do we look for?
What is the Environment
Do you know what price action does in this particular time of year?
Firstly, we must have the gumption and wits to know what market we are operating in. Refer to my last post for seasonality tips and what times of the year match up to what types of markets. i.e. summer=chop, end of year=bullish. Once we identify what environment we are in we can start to form a narrative on whether we want to place a short trade, a long trade, or not place a trade at all. Lets say we are operating in a bear market. We will be looking for swing shorts. Lets say we want to find a multiday runner. Well, we need to wait for key identifiers to try and get ourselves positioned for that trade. Look at the picture above this paragraph and observe the pattern on the right. We will be patiently waiting for this pattern to emerge so that we can engage. Look for a lower high, a swing high (which will be your highest bar), and lastly, your final lower high. Your two lower highs can be any size or shape, as long as they are not higher than your middle swing high bar. Why is this pattern so useful? It gives you (the trader) a great opportunity to position yourself with minimal risk, and endless reward.
Questions to Ask Yourself
What are some other nuances that must be considered when taking a trade based on this pattern? We can give ourselves even more of an edge by taking the trade after a market rally. Why? The rally must occur for the next down leg to occur. That’s how price action works, and orders are matched.
Bottoming Pattern
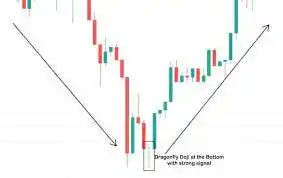
Lets take a look at another identifier to consider when taking this swing trade using a daily bias. If our swing high bar has a very small body, this could be a sign of a reversal. This means steam has run out from one direction and a reversal is on the horizon.
Putting Everything Together
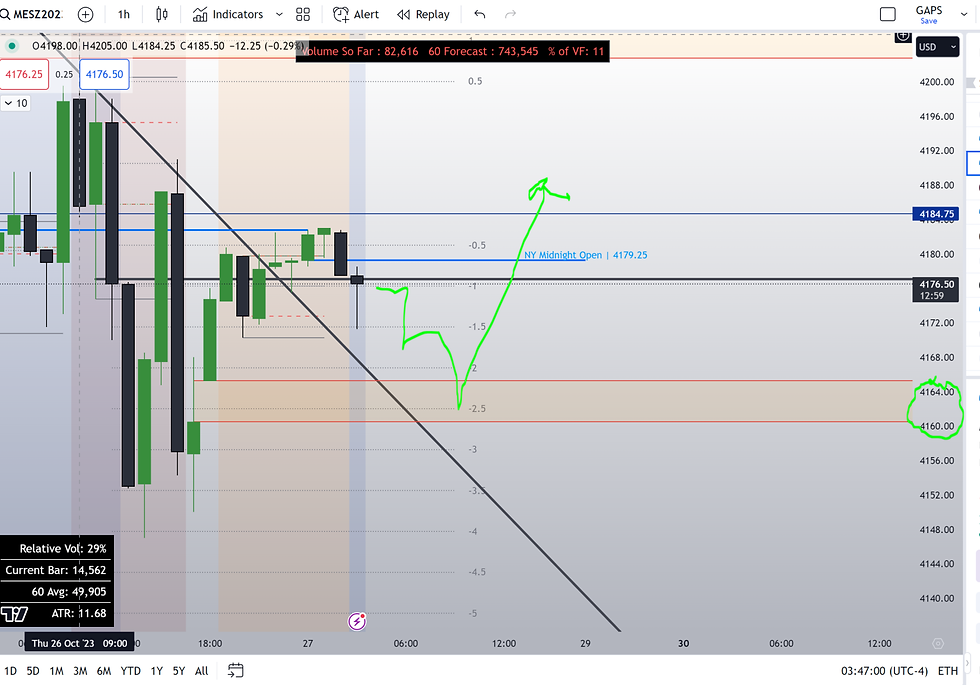
So how can we put all of this information together and actually use it to trade? First, we determine what type of market we are currently in. Next, we wait for a generous price surge to occur. Then, we wait for a lower high and then a proceeding potential swing high to print. If the swing high has a small body with long wicks on each end, this gives us even more confidence to enter. Now come the speculation piece. We want to enter on either a Tuesday or Wednesday unless we are trading around volatility events like OPEX, end of month, quad witching, FOMC etc. Where do we enter? The easiest way to enter the trade is to scale in and put your stop above swing high days high. If the high is taken we know our trade is invalid. You must watch price action around your zone to figure out exactly where to enter. If you start to see weakness on the tape, enter and put your stop above swing highs high from the previous day. The beautiful thing about this trade is it doesn't require significant size due to the likely multi day run you are likely to bank.


Comments